Read ETF Quote Chart on Yahoo Finance
How to read the live ETF (Exchange-Traded Fund) quote chart on Yahoo Finance?
✍: FYIcenter.com
![]() If you are interested to buy or sell some shares of an ETF,
you should read information its quote chart
provided by Yahoo Finance as described below.
If you are interested to buy or sell some shares of an ETF,
you should read information its quote chart
provided by Yahoo Finance as described below.
1. Go to finance.yahoo.com/quote/SPY/. You will see the live stock quote chart for "SPY", the SPDR S&P 500 ETF Trust share.
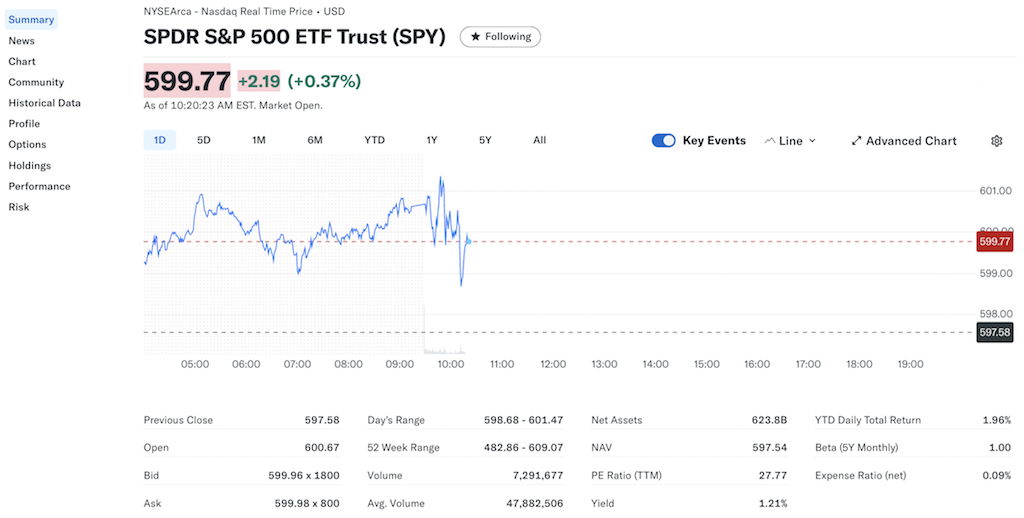
2. Read the chart top down and left right.
NYSEArca - Nasdaq Real Time Price • USD - This tells us that quotes are real time, in US dollars, and from NYSE (New York Stock Exchange) Arca, which is an electronic securities exchange.
SPDR S&P 500 ETF Trust (SPY) - This shows the full name of the ETF and sticker symbol "SPY", which identifies the stock on the given exchange market.
599.77 +2.19 (+0.37%) As of 10:20:23 AM EST. Market Open. - This tells us the price of the last trade of the regular trading session, 599.77; the price change from previous regular trading session, +2.19; the price change in percentage, +0.37%.
(Historical quote chart) - This graphical chart displays historical quotes in 1-day, 5-day, 1-month, 6-month, year-to-day, 1-year, 5-year or all-time scale. This is an interactive chart. So you can play with it using different options and settings.
Previous Close: 597.58 - This is the last trading price before the last regular trading session closing time.
Open: 600.67 - This is the first trading price of this regular trading session.
Bid: 599.96 x 1800 - This shows the price and shares of the last bidding quote.
Ask: 599.98 x 800 - This shows the price and shares of the last asking quote.
Day's Range: 599.68 - 601.47 - This shows the lowest price and highest price of today's trading orders.
52 Week Range: 482.68 - 609.07 - This shows the lowest price and highest price of past 52 weeks.
Volume: 7,291,677 - This is the number of shares traded during today's session.
Avg. Volume: 47,882,506 - This is the average number of daily trading volumes of last 6 months.
Net Assets: 623.8B - This is the total net asset value of the ETF, calculated as the sum of market values (evaluated at previous closing prices) of all security shares hold by the ETF.
NAV (Net Asset Value) 597.54 - This is the per share value of net asset. So SPY has about, 207.851B/224.79 = 925M, outstanding shares.
PE Ratio (TTM): 27.77 - This is the Price-to-Earning Ratio for the Trailing Twelve Months. It is calculated as: PE = Price / (EPS TTM).
Yield: 1.21% - This is the total dividends of the Trailing Twelve Months divided by the NAV at the last dividend date. From historical data, you see (Dividend TTM) = 1.97 (Dec 20, 2024) + 1.75 (Sep 20, 2024) + 1.76 (Jun 21, 2024) + 1.60 (Mar 15, 2024) = $7.08. If you divide it by the NAV of last dividend date, you get: 7.08 / 590.509954 = 1.1989637%, lower than 1.21%.
YTD Daily Total Return: 1.96% - This is the YTD (Year To Date) return calculated as price change rate from the year end price of last year to the previous closing price: (597.58 - 586.08 ) / 586.08 = 1.96%.
Beta (5Y Monthly): 1.00 - Beta is the second main metric that measures volatility of the stock. It is calculated by comparing stock's monthly return against the S&P 500 over the last 5 years. Beta of SPY = 1.00, because it holds the same securities as the S&P 500.
Expense Ratio (net): 0.09% - This is the ratio of expense (management fee) over net asset per year. So State Street Global Advisors charges about 0.09% * $623.8B = $561.42M to manage SPY.
⇒ Read Mutual Fund Chart on Yahoo Finance
2025-01-22, ∼711🔥, 0💬
Related Topics: