Read Stock Quote Chart on Yahoo Finance
How to read the live stock quote chart on Yahoo Finance?
✍: FYIcenter.com
![]() If you are interested to buy or sell some shares of a stock,
you should read information its quote chart
provided by Yahoo Finance as described below.
If you are interested to buy or sell some shares of a stock,
you should read information its quote chart
provided by Yahoo Finance as described below.
1. Go to finance.yahoo.com/quote/IBM/. You will see the live stock quote chart for "IBM", the IBM (International Business Machines Corporation) common share.
2. Read the chart top down and left right.
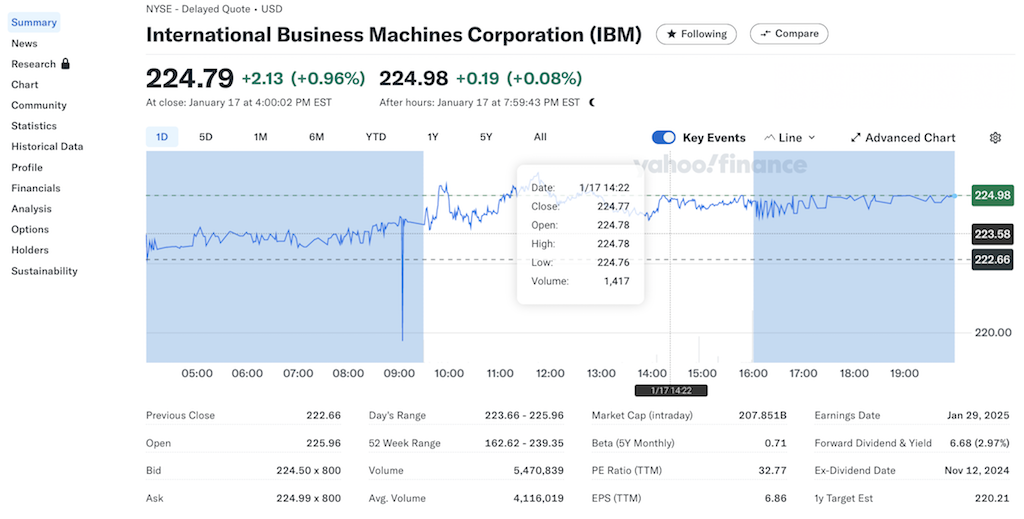
NYSE - Delayed Quote • USD - This tells us that quotes are delayed (not real time) currently, in US dollars, and from NYSE (New York Stock Exchange).
International Business Machines Corporation (IBM) - This shows the full name of the stock and sticker symbol "IBM", which identifies the stock on the given stock market.
224.79 +2.13 (+0.96%) At close: January 17 at 4:00:02 PM EST - This tells us the price of the last trade of the regular trading session, 224.79; the price change from previous regular trading session, +2.13; the price change in percentage, +0.96%.
224.98 +0.19 (+0.08%) After hours: January 17 at 7:59:43 PM EST - This tells us the price of the last trade of the after-hours trading session, 224.98; the price change from previous regular trading session, +0.19; the price change in percentage, +0.08%.
(Historical quote chart) - This graphical chart displays historical quotes in 1-day, 5-day, 1-month, 6-month, year-to-day, 1-year, 5-year or all-time scale. This is an interactive chart. So you can play with it using different options and settings.
Previous Close: 222.66 - This is the last trading price before the last regular trading session closing time.
Open: 225.96 - This is the first trading price of this regular trading session.
Bid: 224.50 x 800 - This shows the price and shares of the last bidding quote.
Ask: 224.99 x 800 - This shows the price and shares of the last asking quote.
Day's Range: 223.66 - 225.96 - This shows the lowest price and highest price of today's trading orders.
52 Week Range: 162.62 - 239.35 - This shows the lowest price and highest price of past 52 weeks.
Volume: 5,470,839 - This is the number of shares traded during today's session.
Avg. Volume: 4,139,065 - This is the average number of daily trading volumes of last 6 months.
Market Cap (intraday): 207.851B - This is the total market value calculated as (last price) x (total number of outstanding shares). So IBM has about, 207.851B/224.79 = 925M, outstanding shares.
Beta (5Y Monthly): 0.71 - Beta is the second main metric that measures volatility of the stock. It is calculated by comparing stock's monthly return against the S&P 500 over the last 5 years. Higher Beta means higher risk. If Beta = 1, the stock has the same risk as the S&P 500. So IBM is less risky than S&P 500.
PE Ratio (TTM): 32.77 - This is the Price-to-Earning Ratio for the Trailing Twelve Months. It is calculated as: PE = Price / (EPS TTM) = 224.79 / 6.86 = 32.76822157434402.
EPS (TTM): 6.86 - This is Earning Per Share for the Trailing Twelve Months. You can calculate this number by reading IBM's financial reports, starting from the last quarterly report: -0.36 (3rd quarter 2024) + 1.96 (2nd quarter 2024) + 1.72 (1st quarter 2024) + 3.55 (4th quarter 2023) = $6.87.
Earnings Date: Jan 29, 2025 - This is the date when the next earning report will be released.
Forward Dividend & Yield: 6.68 (2.97%) - This shows the estimated total dividend of next 12 months per share, and its percentage value over last trading price. Forward Dividend, also called Indicated Yield, is calculated as (Last Quarter Dividend) * 4 = $1.67 (distributed on Nov 12, 2024) * 4 = $6.68.
Ex-Dividend Date: Nov 12, 2024 - This is the date when the last dividend was distributed.
1y Target Est: 220.21 - This is what the share price will be in 1 year estimated by market analysts.
⇒ Read ETF Quote Chart on Yahoo Finance
2025-01-22, ∼572🔥, 0💬
Related Topics: